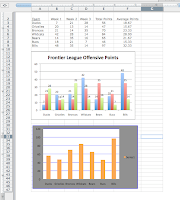
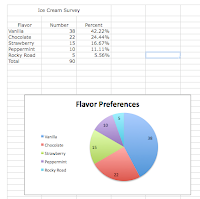
 Microsoft Excel and Google Spreadsheet are useful programs that are used especially for recording data, such as charts or graphs. I have learned to create equations that make data-recording easier, how to create and edit graphs, how to create charts, etc.
Tips
-In Microsoft Excel, if you click on the
"fx" icon at the top of your toolbar, you can assign equations to
certain cells in your graph. For example, if cell A3 is a sum of the cells
above it, click the cell A3, then the "fx" icon, then double-click sum.
Highlight the cells above A3, and you have created a formula!
-To create a graph, first create a chart and highlight the data you want
in your graph.
 -In Google Spreadsheet, when you go to create a graph, you will
automatically go into an editing window. Under “Start,” you can choose which
chart you want. Under “Charts” you may choose from a series of different kinds
of bar charts or pie charts. Under “Customize,” you can edit colors and titles.
-In Spreadsheet, you can also show your documents to others by clicking "share." -In Google Spreadsheet, when you go to create a graph, you will
automatically go into an editing window. Under “Start,” you can choose which
chart you want. Under “Charts” you may choose from a series of different kinds
of bar charts or pie charts. Under “Customize,” you can edit colors and titles.
No comments:
Post a Comment